To deliver healthy and safe working lives and contribute to productive enterprises
Fatal Workplace Injuries
Fatal Workplace Injuries by Economic Sector 2026 (NACE Revision 2)

(Updated as of July 14th 2026. Statistics are updated once a fatal accident has been confirmed as a work-related fatality.)
Download Fatal Workplace Injuries By Economic Sector 2026
These are provisional figures and are subject to change.
Fatal Workplace Injuries by Economic Sector 2016-2025 (NACE Revision 2)
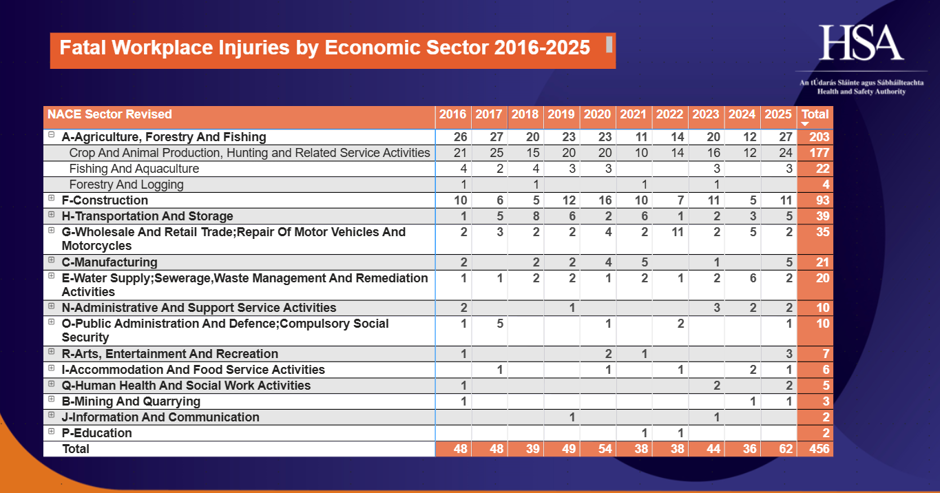
(Updated as of July 31st 2026)
Download Fatal Workplace Injuries By Economic Sector 2016-2025
These are provisional figures and are subject to change.
Rate of fatal work-related incidents per 100,000 workers

(Updated as of July 31st 2026)
Download Rate Of Fatal Work Related Incidents Per 100000 Workers
These are provisional figures and are subject to change.
Fatal incident overview 2021 - 2025
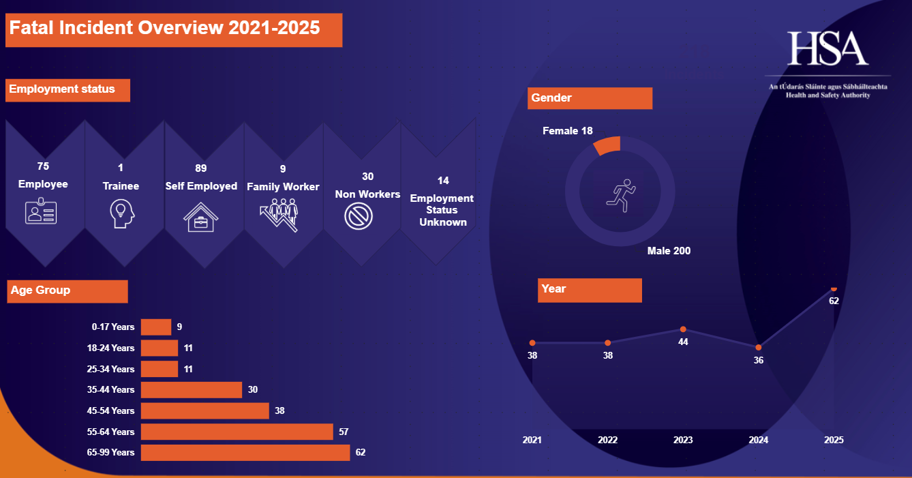
(Updated as of July 31st 2026)